How Much Does Solar Panel Installation Cost in 2026?
The cost of solar panel installation in 2026 depends on more than the panels on your roof. System size, equipment, labor, roof condition, and local permitting can all change the final quote. A home with a simple, sun-facing roof may need less work than one with several roof angles or an aging electrical panel. Small details matter.
This guide explains the main costs homeowners may encounter, from panels and inverters to installation and optional battery storage. It also looks at how electricity use, local incentives, financing, and utility rules can affect the price you ultimately pay. Incentives and regulations can change, so check current information with official agencies and your utility before making a decision.
A quote is not the whole story. Compare itemized estimates, equipment warranties, and expected system output—not just the headline price. Ask whether roof repairs, electrical upgrades, or monitoring fees are included. These can be easy to miss. Any savings estimate is still an estimate; future energy rates, household use, and system performance may differ from projections. I would treat unusually confident payback promises with care. This overview can help you ask better questions, but a qualified local installer must assess your home and provide a site-specific proposal.
What Is the Average Cost of Solar Panel Installation in 2026?
For a typical U.S. home, solar panel installation in 2026 may cost about $20,000 to $30,000 before incentives. A 7-kilowatt system priced near $3.50 per watt would come to roughly $24,500. That is a useful planning estimate, not a guaranteed quote. Local labor rates and equipment prices can shift the final figure.
The average depends on the roof and the work behind the panels. A simple roof with good sun exposure may need little extra labor. Older wiring, a crowded electrical panel, steep roof sections, or complicated permits can add costs. Battery storage is usually an additional expense, often several thousand dollars or more. Ask for an itemized estimate showing system size, panels, inverter, labor, permit fees, and any proposed electrical upgrades.
Compare at least three written quotes for the same system size and equipment scope. Check whether each estimate includes utility interconnection and roof repairs, if needed. Incentives vary by location and may change, so confirm current eligibility before subtracting them from your budget. Averages can mislead. I would treat the middle of the range as a starting point, then question any quote that seems unusually low or high.
How Do System Size and Home Energy Use Affect the Price?
A solar system’s size, measured in kilowatts, is one of the clearest drivers of installation cost. A home using 900 kilowatt-hours monthly may need fewer panels than one using 1,500, but usage alone does not determine the design. Roof direction, shade, and local sunlight affect how much each panel produces. So does when electricity is used. A household that runs air conditioning in the afternoon may match solar production more easily than one with heavy evening use. That matters.
Larger systems usually require more panels, racking, and labor, but total cost does not always rise in a perfectly straight line. Inverters, permits, and electrical work can create fixed costs; an older panel may need upgrading. Battery storage adds another substantial expense, especially when the home needs power after sunset. A quote should state the proposed system size, expected annual output, and whether storage or electrical upgrades are included. Compare those details, not just the total. Even a careful estimate can miss a future heat pump or changing family routines. Reviewing a full year of utility bills helps, though one year may not predict the next. In 2026, local labor rates, available incentives, roof conditions, and installer assumptions can all shift the final price.
How Much Does Solar Panel Installation Cost in 2026? — How Do System Size and Home Energy Use Affect the Price?
| System Size |
Typical Annual Home Use |
Estimated Annual Solar Generation |
Estimated Installed Cost |
How Energy Use Affects the Price |
| 4 kW |
4,000–6,000 kWh |
4,800–6,400 kWh |
$10,000–$14,000 |
Often suits lower-use homes; higher consumption may require a larger system. |
| 6 kW |
6,000–8,000 kWh |
7,200–9,600 kWh |
$15,000–$21,000 |
A common fit for moderate use; electric heating or a vehicle can raise the required size. |
| 8 kW |
8,000–11,000 kWh |
9,600–12,800 kWh |
$20,000–$28,000 |
Can serve higher-use households, subject to roof space and local sunlight. |
| 10 kW |
10,000–13,000 kWh |
12,000–16,000 kWh |
$25,000–$35,000 |
Higher use generally means more panels and a higher upfront system cost. |
| 12 kW |
12,000–16,000 kWh |
14,400–19,200 kWh |
$30,000–$42,000 |
May fit very high electricity use; a site assessment is especially important at this size. |
|
Estimates are illustrative U.S. installed prices before incentives, based on approximately $2.50–$3.50 per watt. Generation assumes roughly 1,200–1,600 kWh per installed kW per year; actual output depends on location, roof orientation, shading, and system design. Battery storage, roof repairs, and electrical upgrades are not included.
|
Which Equipment and Installation Costs Make Up the Total?
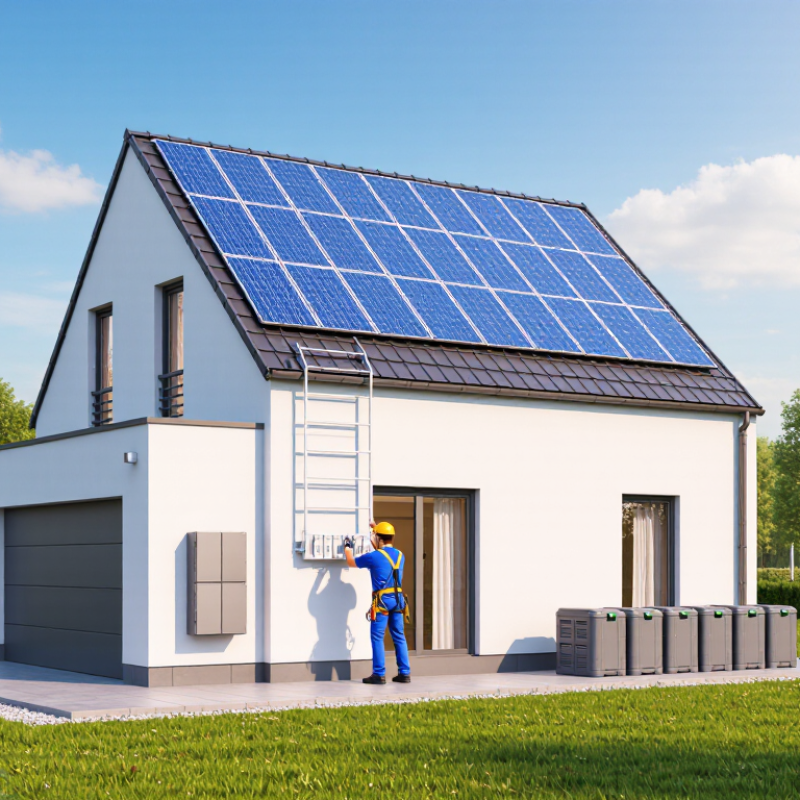
In 2026, a solar installation quote usually combines equipment, labor, and project-specific expenses. Solar panels are a major equipment cost, but they are not the whole system. An inverter converts the panels’ direct-current electricity into household-useable power. Racking, roof attachments, wiring, and safety switches complete the core setup. Small details matter.
A home battery can add substantially to the total, and it may be optional if storing power is not a priority. Installation costs depend on roof shape, access, and the distance between the panels and electrical equipment.
A steep roof or a long cable run can require extra labor and materials. Older electrical panels may also need upgrades before the system can be connected.
Permitting, inspections, and utility connection work may appear as separate quote items or be included in a bundled price. Ask for an itemized estimate that distinguishes equipment from labor and lists any likely extra charges. Comparing only the advertised system price can hide important differences. A common budgeting mistake is overlooking roof repairs; even a small leak discovered during installation can change the project scope. Estimates vary by location, home, and system size, so treat broad online figures as starting points, not promises.
How Do Incentives, Financing, and Local Rules Change the Cost?
An advertised system price is only the starting point in 2026.
Berkeley Lab’s Tracking the Sun 2024 report put the 2023 median residential installed price near
$3.3 per watt,
before incentives. For a 7-kilowatt array, that benchmark is about
$23,100. Roof condition, electrical upgrades, and utility territory can shift the actual quote.
Not a promise.
For U.S. homeowners, the federal residential clean-energy credit generally does not cover expenditures made after
December 31, 2025. State rebates, local programs, and utility incentives therefore matter more, but their funding and eligibility rules vary.
Ask for current written terms. Net-metering policies also change the value of exported power: identical midday surplus can earn different credits across utility areas. Permit charges and interconnection upgrades may appear late in the process.
Financing changes the real cost, not just the monthly payment.
Compare the cash price, APR, loan term, total payments, and any dealer fee; a low payment can conceal a larger financed balance. For leases or power-purchase agreements, review annual price increases and buyout terms. The U.S. Department of Energy advises comparing multiple bids and checking performance assumptions.
The paperwork can still be confusing.
How Can Homeowners Estimate Their 2026 Solar Installation Cost?
To estimate a 2026 solar installation cost, start with your likely system size and a current local price per watt. EnergySage’s 2025 marketplace data put the average U.S. quoted price near $2.53 per watt before incentives. A 10-kilowatt system would therefore cost about $25,300 as a rough benchmark. Not a quote. Your roof, local labor, electrical upgrades, and equipment choices can change that figure. Battery storage usually adds a separate cost.
Tips: Check your last 12 months of electricity bills, not just one summer bill. Ask installers to show system size, price per watt, permits, and any roof or panel-upgrade charges separately. Compare at least three written quotes.
Treat national averages as a starting point, not a promise. The Lawrence Berkeley National Laboratory’s Tracking the Sun report documents substantial variation in residential system prices, including differences by system size and location. For a practical estimate, multiply your proposed system’s watts by local quotes, then add clearly itemized extras. Compare cash prices separately from financing payments; loan fees can make headline prices hard to compare. Incentives may also depend on rules in effect when your system is installed, so verify current eligibility with official sources. Estimates are imperfect—mine would be too, without a roof inspection and utility-bill review.