2026 Top Texas Solar Panel Manufacturers?
Choosing among the 2026 Top Texas Solar Panel Manufacturers requires more than comparing advertised prices. Texas solar customers face intense heat, hail, dust, changing electricity rates, and wide regional differences. A reliable manufacturer must consider all of them.
Dr. Joshua Rhodes, an energy researcher at the University of Texas at Austin, has stated, “Solar and wind are now the cheapest sources of electricity generation.” That observation explains Texas’s growing solar market, but it does not make every panel equally suitable. A low price can hide weaker warranties, slower service, or poor performance in high temperatures. This guide examines manufacturers through practical criteria, including module efficiency, temperature tolerance, durability, warranty coverage, supply stability, and installer support. It also considers whether companies serve Houston’s humid climate, West Texas’s intense sunlight, and the storm-prone Gulf Coast.
Real-world details matter. A rooftop panel may look excellent on paper, yet perform differently under heavy dust or partial shade. Manufacturer reputation matters, too. So does the clarity of warranty claims.
No ranking is perfect.
Market conditions can shift quickly. Product lines, certifications, and availability may change before installation begins. Therefore, this overview aims to provide a careful starting point, not a permanent verdict. Readers should verify current specifications, independent testing, and local installer experience before signing a contract. The best texas solar manufacturer is not always the largest one. It is the company whose technology, support, and long-term commitments fit the property.
Texas Solar Manufacturing Scope: In-State Facilities, Cells, and Module Capacity
2026 Top Texas Solar Panel Manufacturers?
Texas Solar Manufacturing Scope: In-State Facilities, Cells, and Module Capacity
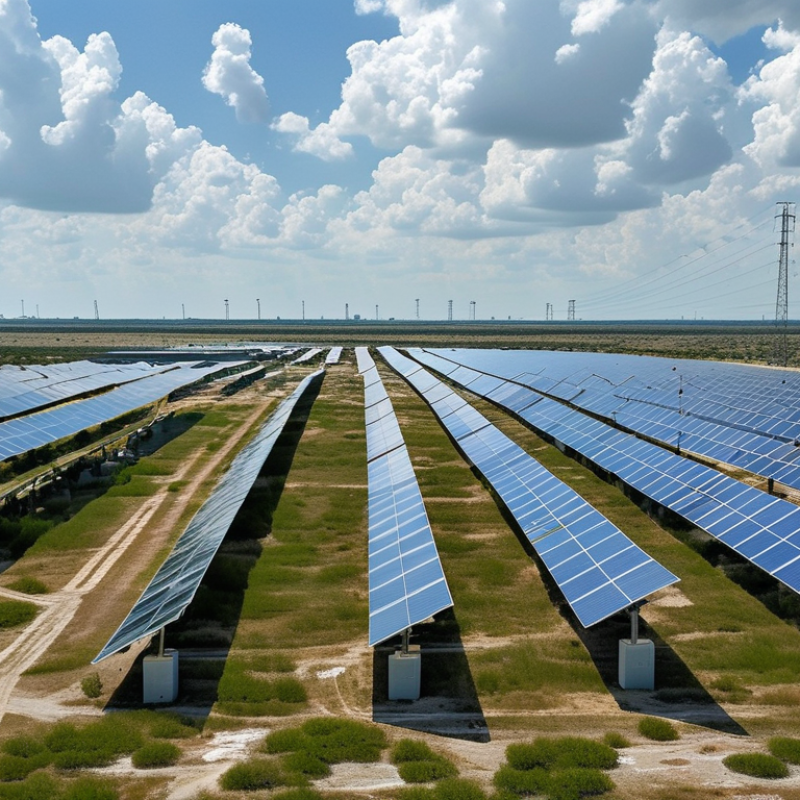
Texas has become a serious solar manufacturing location, supported by large industrial sites, strong logistics, and abundant electricity demand. In-state facilities now cover several stages, including silicon processing, wafer handling, cell production, and module assembly. However, these stages are not equally developed. Module assembly is usually easier to scale than cell or wafer manufacturing.
A credible 2026 assessment should separate announced capacity from operating capacity. A factory may advertise several gigawatts of annual output, while actual production remains lower during equipment testing or workforce expansion. This difference matters to developers seeking dependable local supply. Facility size, production lines, and shipment records provide stronger evidence than project announcements alone.
Cell manufacturing deserves close attention. It requires tighter process control, specialized equipment, and stable chemical inputs. Texas offers industrial infrastructure, but local supply chains are still developing. Some manufacturers may depend on materials or components shipped from outside the state. That is a practical weakness.
Module capacity can grow faster.
Evaluators should inspect annual utilization, product formats, quality testing, and delivery history. They should also review whether a site produces cells or only assembles imported cells into finished panels. Public records can be incomplete, and capacity figures may change quickly. A careful buyer should verify current operations directly before treating any facility as a top Texas manufacturer.
2026 Top Texas Solar Panel Manufacturers? - Texas Solar Manufacturing Scope: In-State Facilities, Cells, and Module Capacity
| Facility ID |
Texas Location |
Manufacturing Scope |
Cell Production |
Module Capacity |
Capacity Status |
Primary Output |
Publicly Reported Position |
| Facility A |
San Antonio |
PV module assembly |
No in-state cell line publicly reported |
Approximately 1 GW/year |
Operating / expanded
|
Crystalline-silicon solar modules |
One of the best-established dedicated module-production sites in Texas |
| Facility B |
Houston area |
PV module assembly and planned scale-up |
No operating Texas cell capacity publicly confirmed |
Up to 2 GW/year announced |
Announced / developing
|
Large-format crystalline-silicon modules |
Important planned Gulf Coast manufacturing expansion; announced capacity should not be counted as operating output |
| Facility C |
Wilmer, Dallas–Fort Worth area |
PV module manufacturing |
No Texas cell production included in the publicly announced project scope |
Approximately 5 GW/year planned |
Announced / ramp-up
|
Utility-scale crystalline-silicon modules |
Among the largest publicly announced Texas module projects by nameplate capacity |
| Facility D |
Mesquite, Dallas–Fort Worth area |
Integrated cell and module manufacturing project |
Up to 5 GW/year announced |
Up to 5 GW/year announced |
Planned / phased
|
Solar cells and finished PV modules |
Significant proposed move toward vertically integrated Texas solar manufacturing |
| Texas Manufacturing Baseline |
Statewide |
Module-focused manufacturing ecosystem |
Cell production is concentrated in announced projects rather than a broad operating base |
Several gigawatts of announced nameplate capacity |
Mixed operating and planned
|
Modules, with limited or developing upstream cell production |
Texas is stronger in module assembly than in operating upstream cell manufacturing |
Note: Capacity figures represent publicly announced annual nameplate capacity where applicable. Announced, planned, or ramp-up capacity is not equivalent to verified operating production.
2026 Market Context: EIA Solar Capacity and SEIA Texas Growth Data
2026 Top Texas Solar Panel Manufacturers?
Texas enters 2026 with unusual solar momentum. The U.S. Energy Information Administration reported rapid national utility-scale solar expansion in 2024, pushing installed capacity above 60 gigawatts. That scale matters for Texas buyers. It supports broader equipment availability, stronger installer experience, and more competition among manufacturers.
SEIA and Wood Mackenzie’s U.S. Solar Industry Insight reports consistently place Texas among America’s fastest-growing solar markets. Their state data shows Texas adding several gigawatts of solar capacity annually, with utility projects driving much of the increase. Large, flat sites near transmission corridors are reshaping procurement decisions. Manufacturers serving Texas must therefore manage heat, hail, wind, and long-distance logistics, not only panel efficiency.
Performance in Texas is site-specific. A high-power module may lose value if its temperature coefficient performs poorly during a hot August afternoon. Buyers should compare degradation rates, independent testing, warranty terms, and supply continuity. The best manufacturer on paper may not be the best practical choice. EIA capacity figures measure deployment, not reliability. SEIA growth figures also cannot predict every project’s outcome. That gap deserves attention.
Ranking Standards: IEC 61215, IEC 61730, NREL Efficiency, and PVEL Scores
For a 2026 Texas solar manufacturer ranking, certification should come before advertising claims. IEC 61215 verifies a module’s design qualification under stresses such as thermal cycling, humidity-freeze, and mechanical loading. IEC 61730 focuses on electrical and fire safety. These standards matter in Texas, where extreme heat, hail, wind, and rapid temperature changes can expose weak designs.
Efficiency needs careful interpretation. NREL’s efficiency chart records laboratory silicon-cell results above 27%, but commercial modules usually achieve less after encapsulation, wiring, and manufacturing limits. A ranking should compare independently tested module efficiency, not laboratory records alone. PVEL’s PV Module Reliability Scorecard adds practical evidence through tests covering thermal cycling, damp heat, humidity-freeze, hail, mechanical stress, and potential-induced degradation. Higher PVEL results suggest stronger field resilience, although scores can vary by product design and test conditions.
Look beyond the headline percentage. Check the exact IEC certificate, testing laboratory, product revision, warranty terms, and PVEL test category. A module passing IEC testing is not automatically the best performer in a Texas installation. That assumption is too simple. NREL data also measures efficiency, not long-term reliability. My ranking method would therefore give the greatest weight to valid IEC 61215 and IEC 61730 certification, then verified efficiency, and finally repeatable PVEL results under harsh conditions. The order may change as new testing data appears.
2026 Top Texas Solar Panel Manufacturers? — Ranking Standards Reference
The chart compares publicly reported NREL research-cell efficiency benchmarks by technology. It is a technical reference and does not rank individual companies or brands.
IEC 61215
Design qualification and type approval for terrestrial photovoltaic modules under environmental and performance stress tests.
IEC 61730
Photovoltaic module safety qualification covering construction, protection against electric shock, fire, and mechanical hazards.
NREL Efficiency
A laboratory efficiency benchmark. Research-cell records should not be treated as commercial module efficiency ratings.
PVEL Scores
Independent reliability testing and scorecard recognition used to compare module performance under accelerated stress conditions.
Source: National Renewable Energy Laboratory, Best Research-Cell Efficiencies chart. IEC 61215 and IEC 61730 are international photovoltaic module qualification standards; PVEL results are published through independent PV reliability testing reports.
Mission Solar and SEG Solar: Comparing Texas Plants by Annual GW Output
Texas is becoming a serious solar manufacturing center. Two large module plants illustrate the difference between factory scale and real production. A San Antonio facility publishes approximately 1 GW of annual nameplate capacity. A Houston-area facility reports about 2 GW per year. These figures suggest a clear scale advantage, but they are not shipment guarantees.
The comparison is not perfectly clean. Nameplate capacity assumes steady material supply, full staffing, and strong customer demand. Actual output can fall during equipment upgrades or logistics delays. The Solar Energy Industries Association and Wood Mackenzie reported nearly 50 GW of new US solar capacity in 2024. That market size supports large factories, yet demand remains uneven across project segments.
Plant location also changes the practical calculation. San Antonio offers proximity to South Texas installers and utility projects. Houston provides stronger port access and industrial infrastructure. According to the US Energy Information Administration, Texas continues to rank among the leading states for utility-scale solar growth. Still, annual GW figures need independent verification through shipment records, operating schedules, and audited disclosures. A 2 GW headline can look impressive. It may describe maximum throughput, not completed modules. That distinction deserves more attention from buyers and analysts.
Manufacturer Comparison: Efficiency, Degradation, Warranty, Price per Watt, and Supply Chain
2026 Top Texas Solar Panel Manufacturers?
Choosing a Texas solar panel manufacturer requires more than comparing advertised efficiency. A practical review should examine output in heat, humidity, dust, and partial shade. Higher efficiency can reduce roof space, but it may increase the purchase price per watt. That tradeoff matters on smaller homes. Degradation rates also deserve attention. A panel losing slightly less output each year can produce more energy over its service life. Still, laboratory figures may not match harsh rooftop conditions.
Warranty language often reveals manufacturer reliability. Check product coverage, performance guarantees, labor exclusions, and claim procedures. A longer warranty is useful only when support remains accessible. Supply chain stability also affects installation schedules and replacement panels. Ask whether inventory is stored domestically or dependent on uncertain shipping routes. Prices can change quickly, so compare written quotes with identical system sizes, monitoring equipment, and installation terms. Some low bids omit important electrical work.
Tips: Request recent regional performance data, not only brochure ratings. Compare price per watt after incentives, not before. Ask who handles warranty claims. Inspect the degradation table carefully. A small wording difference can matter. I would also keep records of invoices, serial numbers, and installation photographs. These details may simplify future service. No comparison is perfect, because roof angle, ventilation, and shading can distort results. A manufacturer with strong specifications may still perform poorly after rushed installation. Verify the installer’s workmanship separately.